


How to Create Reports That Help You Measure Marketing Performance:
-
Admin_Techhub / 7 months
- December 18, 2025
- 0
- 1 min read

Performance reports should do more than summarize data—they should guide decisions. Creating effective reports starts with defining clear objectives and selecting the right metrics.
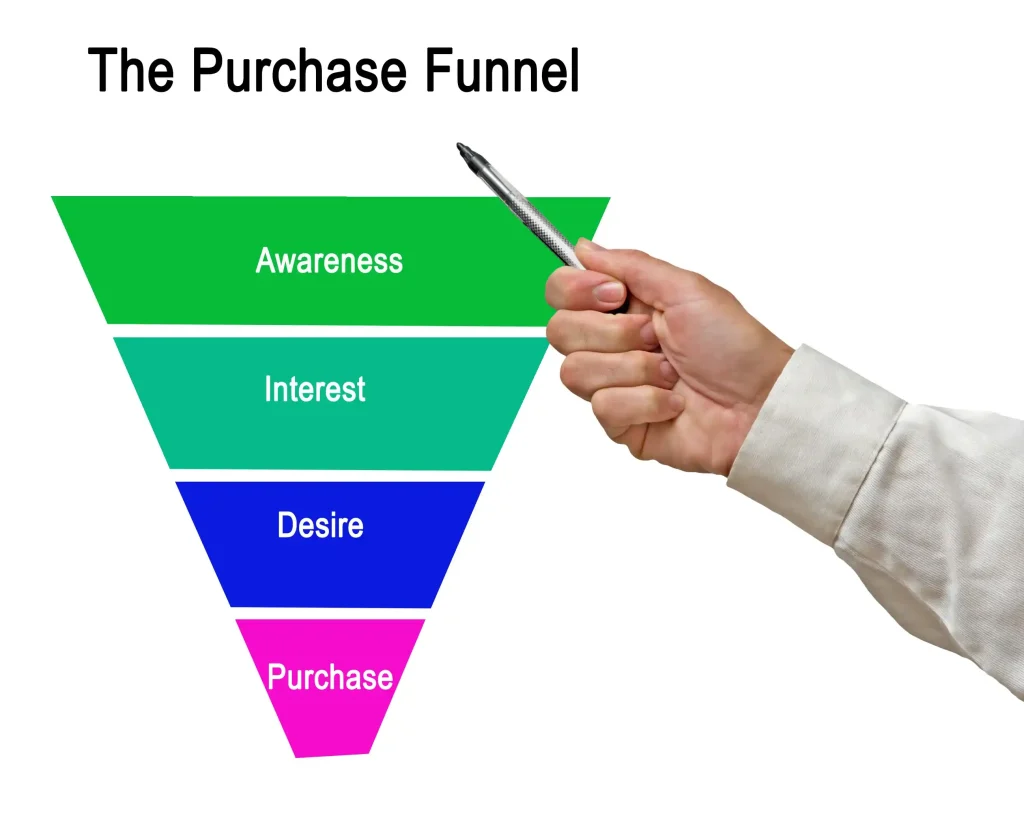
Begin by aligning reports with business goals. For lead generation, track conversion rates, cost per lead, and channel performance. For revenue-driven campaigns, include ROI, customer acquisition cost, and lifetime value. Avoid vanity metrics that don’t contribute to decision-making.
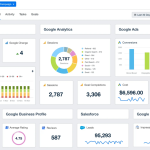
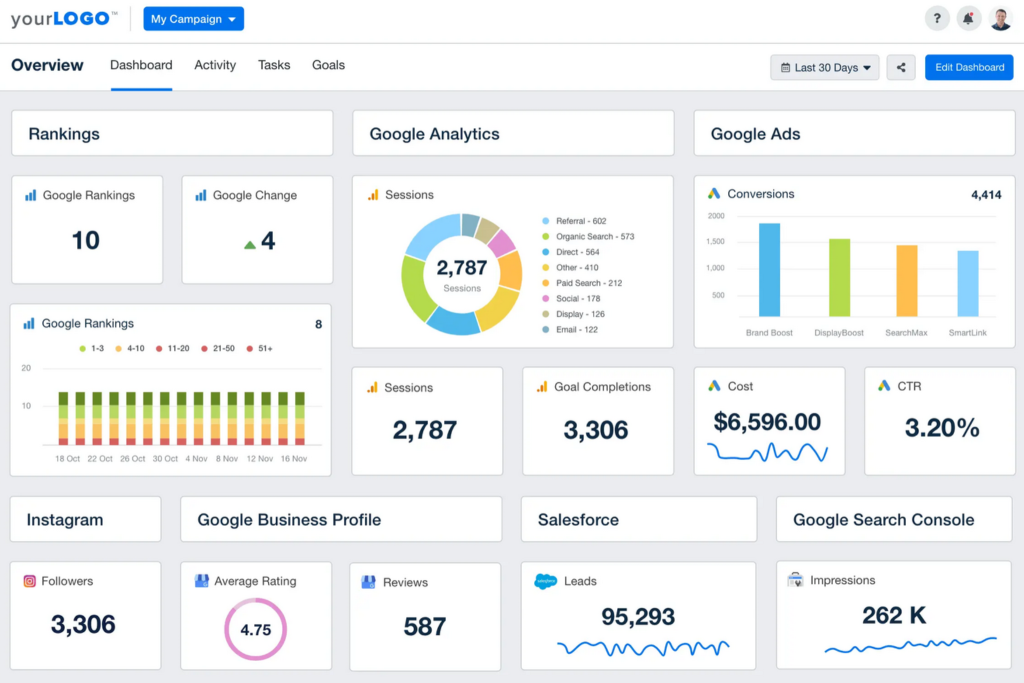
Choose tools that support integration and automation. Google Analytics 4, HubSpot, and Salesforce provide reliable performance data, while Looker Studio and Power BI turn that data into readable reports. Automating data collection ensures accuracy and consistency.
Visualization is critical. Use charts and graphs to highlight trends, comparisons, and growth patterns. Annotations explaining spikes or drops help stakeholders understand context and implications.
Include actionable insights in every report. Summarize key findings and recommend next steps. For example, identify high-performing channels worth scaling or underperforming campaigns that need optimization.
Well-structured performance reports turn data into direction. They help teams measure success accurately, improve accountability, and continuously refine marketing strategies based on evidence.